
A print shop stops pulling reports by hand and trusts the numbers.
The problem
The shop runs everything through Printavo, its order-management software. Answering “how are sales this month?” meant pulling reports by hand, one view at a time.
The software’s API only allows a few requests at a time, and its tax, discount and date fields don’t mean what they look like they mean, so a simple report came out different from the owner’s numbers.
What I built
Nightly sync to a fast database
Orders, line items and customers copy into the shop’s own database on a schedule, so every dashboard loads in under a second at any date range.
Seven dashboards
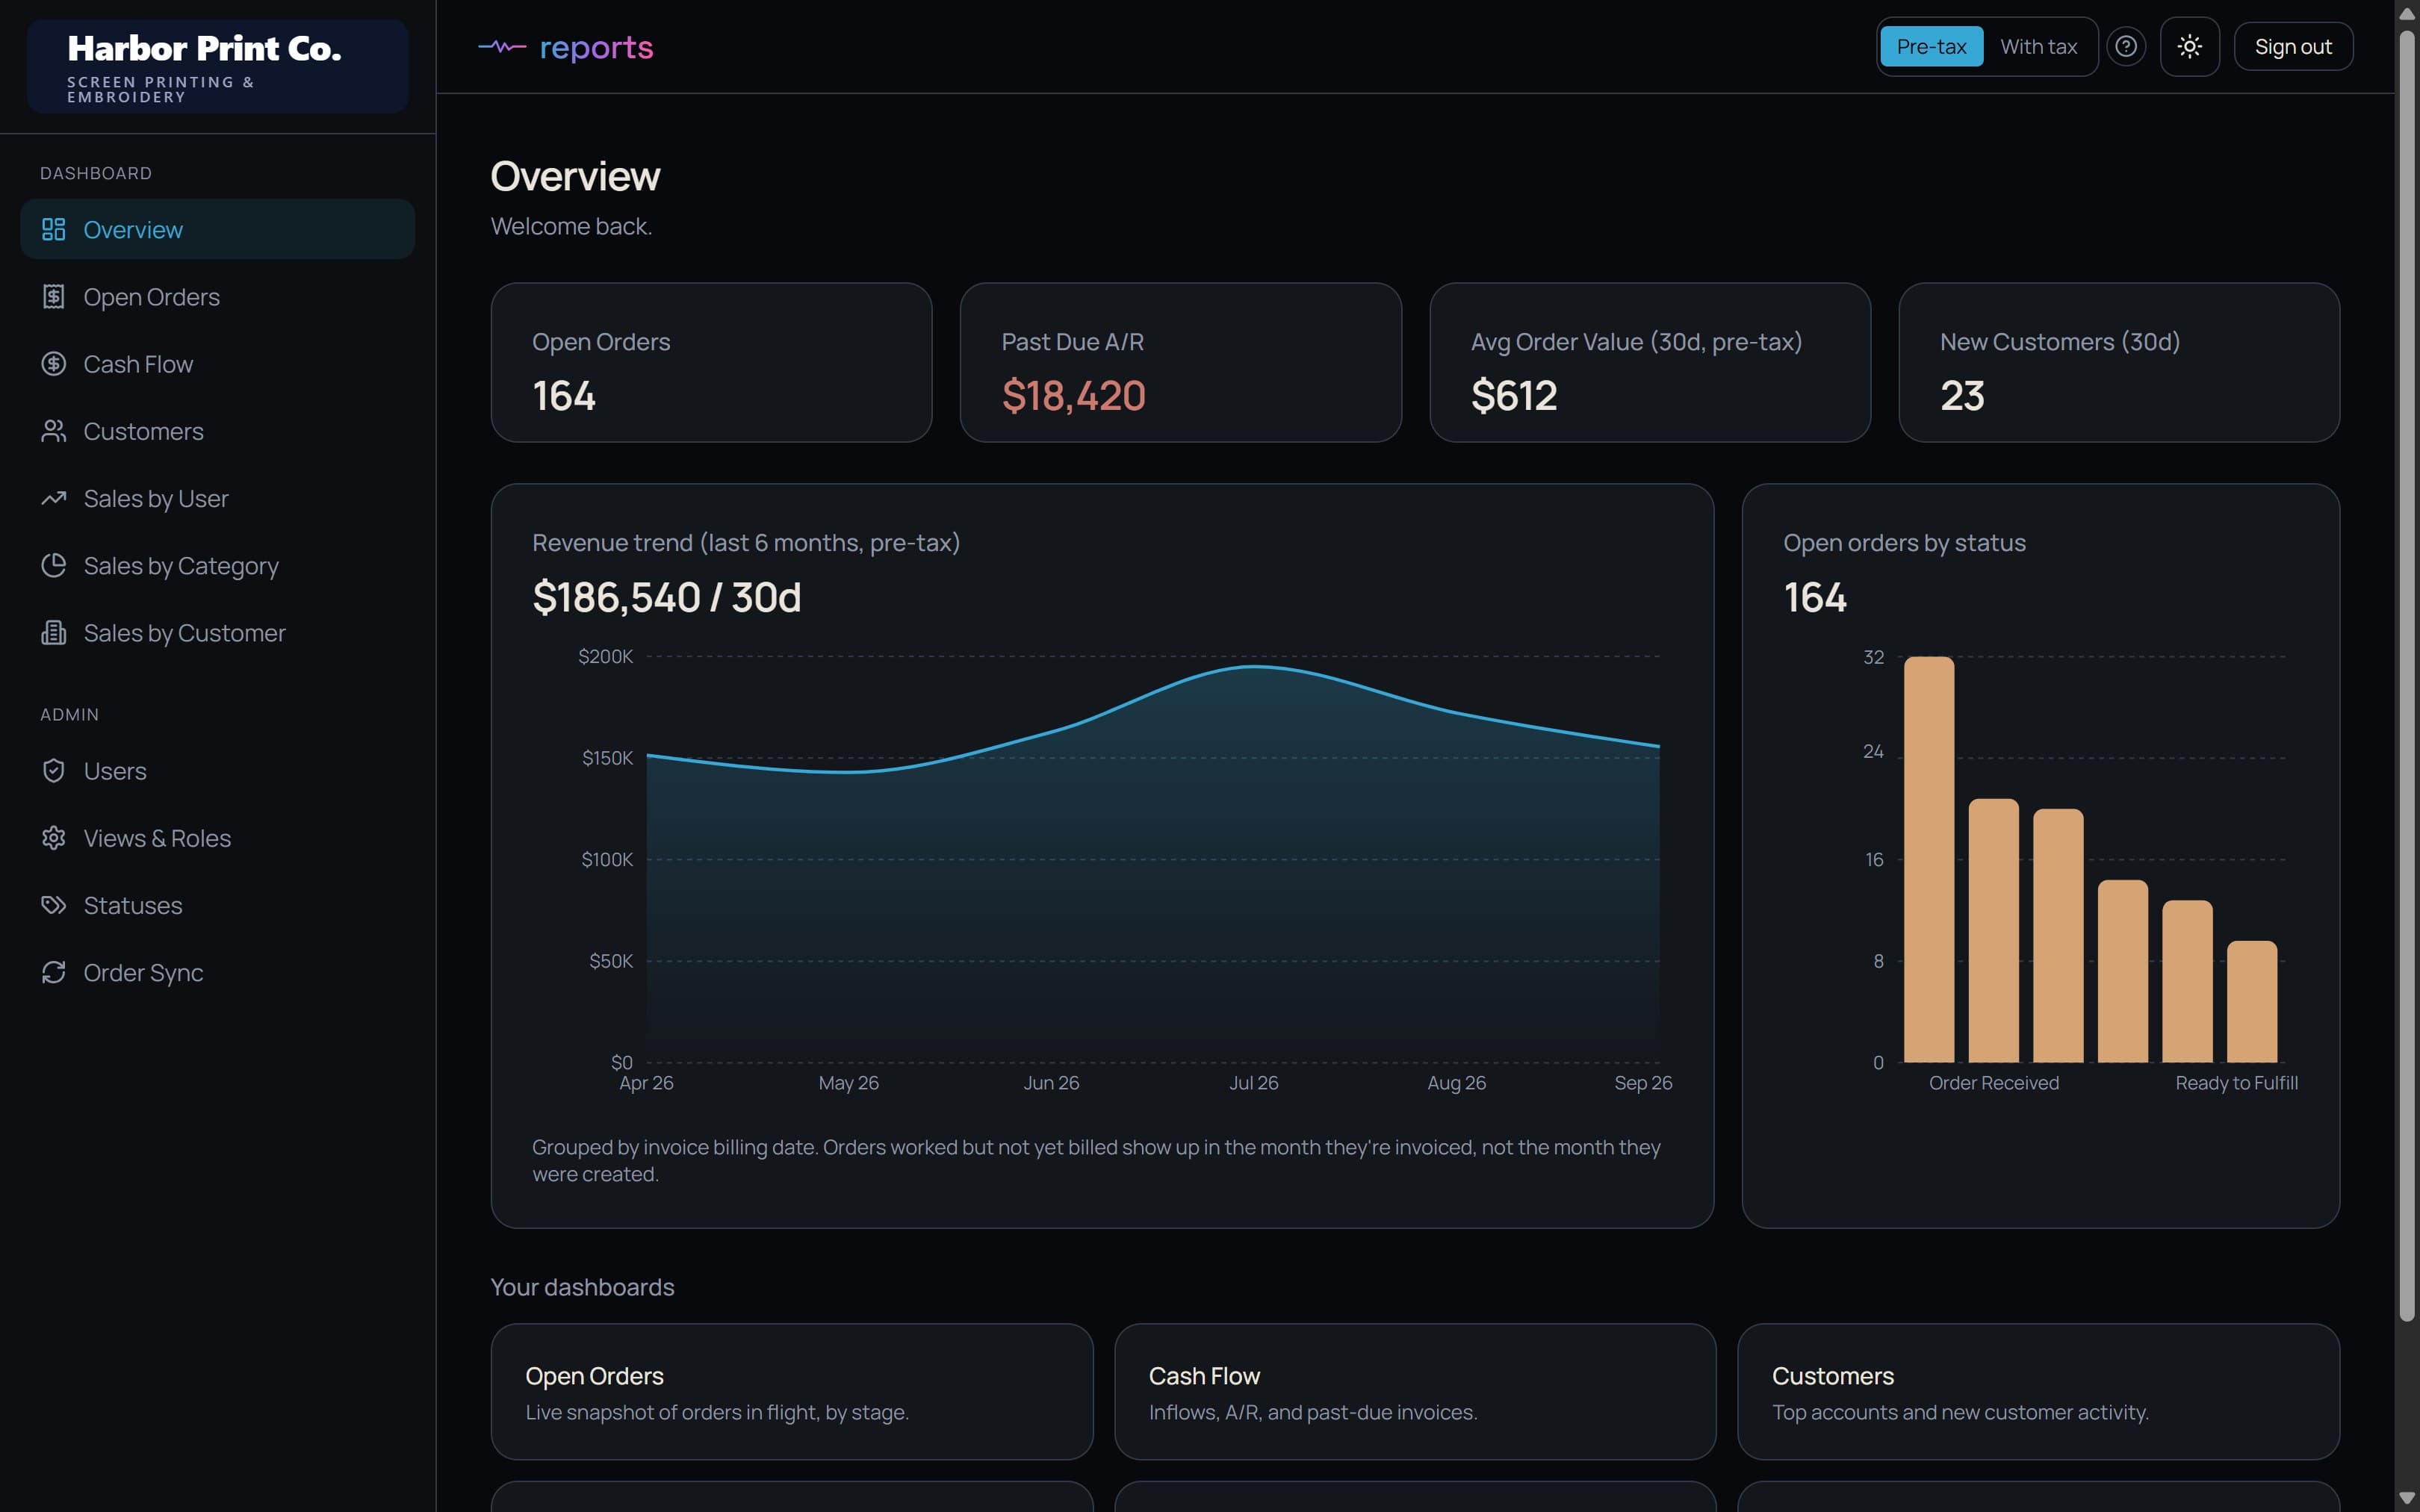
Sales by rep, customer and category, cash flow, open orders, customers, and an owner’s overview, with year-over-year drill-downs.
Staff logins with permissions
Google or email sign-in, with each person seeing only the views they should.
One-click reports
Any view exports to CSV or a clean PDF for the accountant or a Monday meeting.
What shipped
Built as a subcontractor. The client’s name is withheld, and the screenshot uses a made-up business name and sample numbers.